The Observability Black Hole
Last year, our microservice architecture crossed the 50-service mark. This wasn't a sudden explosion, but a gradual sprawl. Services were written in Go, Python, and a few legacy Node.js monoliths refusing to die.
When user requests started timing out, tracking down the latency bottleneck felt like finding a needle in a haystack—if the haystack was actively on fire and changing shape every 5 minutes. We were using a managed APM solution, but the sampling rates were too aggressive, resulting in massive visibility gaps for P99 anomalies.
So, we did what any stubborn engineering team would do: we built our own.
Architecture
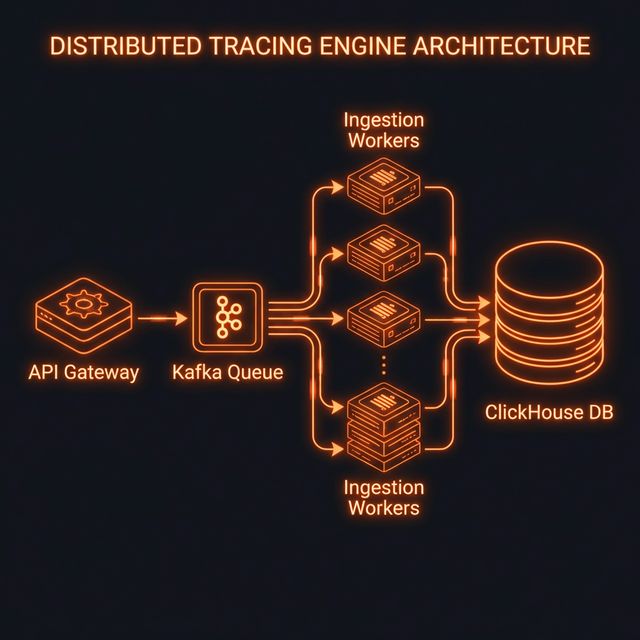 Sentinel Tracing Architecture
Figure 1: High-level ingestion and storage pipeline for Sentinel.
We named the system Sentinel. The goal was simple but aggressive: ingest 100% of spans without sampling, maintaining sub-millisecond P99 latency at the API gateway layer.
1. Ingestion via Rust
We chose Rust for the ingestion workers. Why Rust? Because GC pauses in Go and Java were causing unacceptable micro-stutters under sudden traffic spikes. With Rust (using Tokio and hyper), we achieved a flatline memory profile and incredibly predictable tail latency.
// A simplified version of our span batching logic
async fn ingest_spans(
    State(queue): State<mpsc::Sender<SpanBatch>>,
    Json(payload): Json<Vec<Span>>
) -> impl IntoResponse {
    let batch = SpanBatch::new(payload);

    // We use a bounded channel to provide backpressure.
    if let Err(_) = queue.try_send(batch) {
        return (StatusCode::TOO_MANY_REQUESTS, "Ingest queue full");
    }

    (StatusCode::ACCEPTED, "OK")
}
2. Buffering with Kafka
The ingestion workers don't write directly to the database. They perform lightweight validation and push the serialized spans into Kafka. This decoupling ensures that database spikes don't block the API workers.
3. ClickHouse for Analytical Muscle
Traces are essentially columnar data. You want to filter by service_name, aggregate by duration_ms, and group by endpoint. There is no better tool for this job right now than ClickHouse.
We heavily utilized ClickHouse's ReplacingMergeTree to handle updates (e.g., closing a span that was previously opened).
Results
After migrating to Sentinel, our APM bill dropped by 80%, and our trace resolution jumped from a 10% sample to 100% full fidelity. The Rust workers barely break a sweat, consuming roughly 120MB of RAM each while processing thousands of requests per second.
The most important metric, however, was MTTR (Mean Time To Resolution). Because developers could now search every single request without wondering "did this get sampled?", incident resolution times fundamentally plummeted.